CoEx is developed to fill the gap between SLP and microarchitectural level profiling, and its main role in ASIP design is to provide a complete solution that helps an engineer through the entire development cycle of a new tailored processor. With CoEx the designer is able to get the same statistics that traditional SLP provide but also to focus on the most interesting functions (for which the ASIP is going to be implemented), while changing the granularity of the analysis at every step to collect either general or very detailed information. Due to this we consider the profiler not only to be fine-grained, but multi-grained, and this characteristic helps designers to quickly prune out uninteresting parts of the code and therefore increase productivity.
CoEx consists of three parts that although in the current implementation are integrated in a single tool, can be easily reused individually in different technologies.
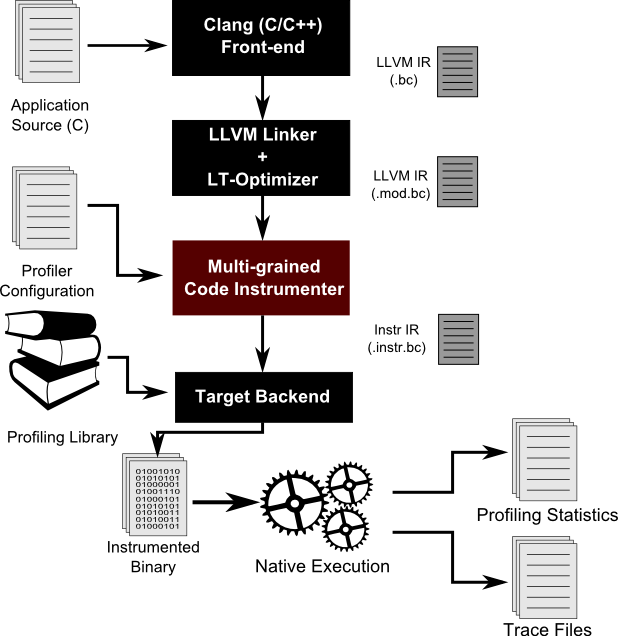
- A multi-granularity LLVM based code instrumenter and API that gets configurations in an XML form and modifies the code with API defined function calls. The API implementation can be replaced at any time, enabling its reuse inside custom flows.
- A highly optimized profiling library to do profiling information storage and bookkeeping.
- A compiler framework independent GUI in which all language and compiler framework specific information is contained within a standardized XML format.
The multi-granularity of the approach relays in several levels. At the highest level the designer can choose to gather only execution time information about the program. This is the top-level most lightweight analysis and serves as an initial peek & peep into the application behavior. As a second level of granularity the user can pick about performing the instrumentation globally throughout the program, or locally for "interesting" functions. This feature helps controlling the amount of information to understand, to focus application analysis and to enable easy optimization and algorithmic exploration. In this level, engineers can choose amongst several analyses, each with different functionality and overhead:
- Function and basic block execution analysis: keeps track of the number of times the program functions and basic blocks were executed. While doing it, keeps track of the branches within a BB, their nature (conditional/unconditional), and also records the function calls within a BB. This analysis also keeps track of the operation nature and count in a given basic block, which helps to analyze the nature of the underlying algorithm.
- Heap/Stack profiling and debugging: when configured, keeps track of the maximum application stack size. It also keeps statistics on memory allocations and maximum required heap size, and informs the user about possible leaks.
- Memory access and value profiling: This two combined analysis keep track of which statements access a given source level memory element (heap variable, local variable or argument) and tracks the minimum and maximum value for each individual variable. This feature is interesting when tailoring architectures and also while doing algorithmic exploration.
- Tracing: Tracing can be enabled individually for function and basic blocks, heap related operations (allocation/deallocation), memory accesses, stack size and heap size.
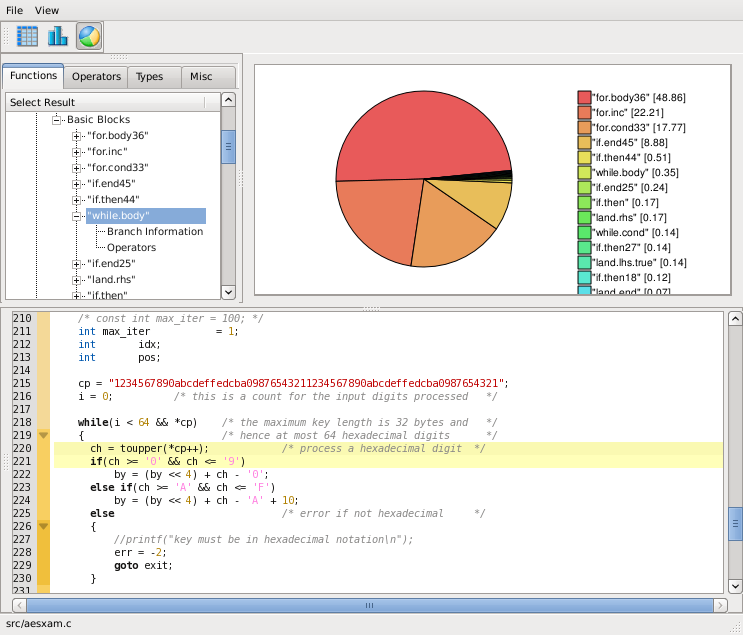
Output from the tool is received in XML form for the execution statistics and as binary files for trace statistics. Execution statistics are usually the input to the GUI, which is used by designers to analyze the application. The GUI displays the information in an intuitive way, linking each result with its corresponding statement inside the code. In such a way, the designer is able to immediately relate profiling information with application, therefore increasing its understanding about it.